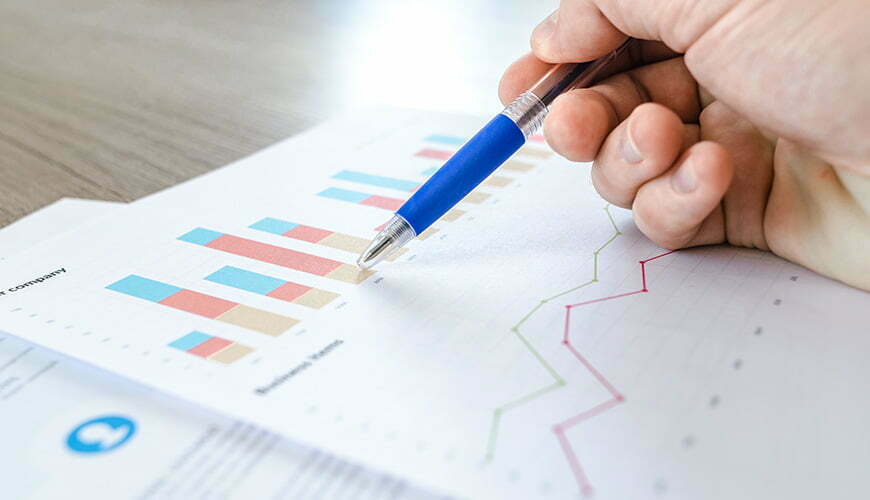
Analytics involves a systematic computational analysis of data or statistics which is used for the discovery, interpretation and communication of meaningful patterns for effective decision making. You can use analytics for your business to describe, predict and improve performances, to research potential trends or to analyse the impacts of certain decisions or events. We have helped companies from multiple sectors use specialized analytics procedures to draw insights from data. Manufacturing companies often record the runtime, downtime and work queue for various machines and we analyse this data to help them create better plans for the workloads so that their machines operate closer to peak capacity. Gaming companies use our data analytics to set reward schedules for players that keep majority of players active in the game.
Data analytics is a core practice of modern businesses and no single tool fits every need. Therefore, choosing the right data analytics tool that fits your organizational needs is paramount. At Opinion Bunch, we use the following data analytics tools that are highly effective and can boost your business in 2020 and beyond.

R Analytics
We provide you insights through R programming which is a powerful and flexible open source software used for heavy statistical computing. We not just analyse your data, but also help you create software and applications to perform reliable statistical analysis through R programming. For business analytics, we use R to build custom data, perform clustering and create analytical models.
In consumer space, we use R to get individual predictive analytics. With predictive analytics, you can make predictions about how long will a consumer stay in the store, how much will your customer spend based on the personal credit status and even decide a loan amount based on one’s online consumption record.
Tableau
Tableau is the fastest growing data visualisation tool which offers fast data analysis. You can see visualisations in the form of dashboards and worksheets that can be easily understood by any professionals at any level in your organisation. With Tableau, we perform data blending and real-time analysis and provide you output in the form of multiple out-of-the-box charts like Bar charts, Pie charts, Packed bubbles charts, and box and Whiskers plot.
If you are a healthcare enterprise, this powerful visual analytics tool which is both easy to use and visually appealing, can help you optimize your workforce, increase the quality of care, and reduce patient costs.


SAS
SAS is another popular software suite that can mine, alter, manage and retrieve data from a variety of sources and perform statistical analysis on it. It provides a graphical point-and-click user interface for non-technical users and more through the SAS language. SAS can handle large volumes of data stored in your databases and extensive system of servers. It comes with comprehensive data security and thoroughly tested algorithms. Thus, the combination of extensive data capacity combined with complete functionality makes SAS our preferred choice for data analytics services especially for banking, IT, healthcare and academies.
SAS is pushing healthcare analytics to new frontiers, improving results across the spectrum of care, from the way healthcare providers measure performance to health outcomes and patient safety.
Python
Python is a general-purpose, versatile and popular programming language. Some of the reasons why we chose this widely popular tool in scientific and research communities are ease of use, quick prototyping, and availability of deep learning frameworks with Python APIs. Python is incredibly productive and versatile. It provides large collection of libraries like Numpy, Pandas and Matplotlib that we use to help you solve complex business problems and build strong systems.
For your enterprise, we use Python to segment customers, analyse customer churn and build models to predict, create, run and analyse A/B tests to support you in making proactive business decisions.


Microsoft Excel
Microsoft Excel is one of the top tools for data analysis and almost all big and small enterprises use Excel in their day-to-day functioning. It comes with built-in analytical features for quantitative researches. We use Excel to summarize your data in flexible ways to enable quick exploration of valuable insights from the accumulated data. We create dashboards to help you keep track of your sales, identify high and low sales trends, and through regression analysis, predict future.


